
Keywords: Sales, Expenses, Reports, Quickbooks
Credit: Intuit- Quickbooks Online Photo By: FP
Struggling to Keep Your Books in Order? 📊📅
Let us handle the numbers while you focus on growing your business! Get expert bookkeeping support tailored to your needs.
👉 Click Here for a Free Consultation!
The Reports center contains a range of standard reports that can be customized and shared with you to provide insight into their businesses. With an understanding of your businesses, and a detailed knowledge of the reporting options in QuickBooks, you’ll know which reports will provide the best insights for you. Let’s take a look at some of the key features of the Reports center and the reports that you’ll find there.
The reports center, accessed through the left-hand menu, is where you can run default reports, save customized reports, and create and share management reports. Reports can easily be found , either by looking in the relevant category (for example, Business Overview and Sales and Customers), or can also be searched by name.
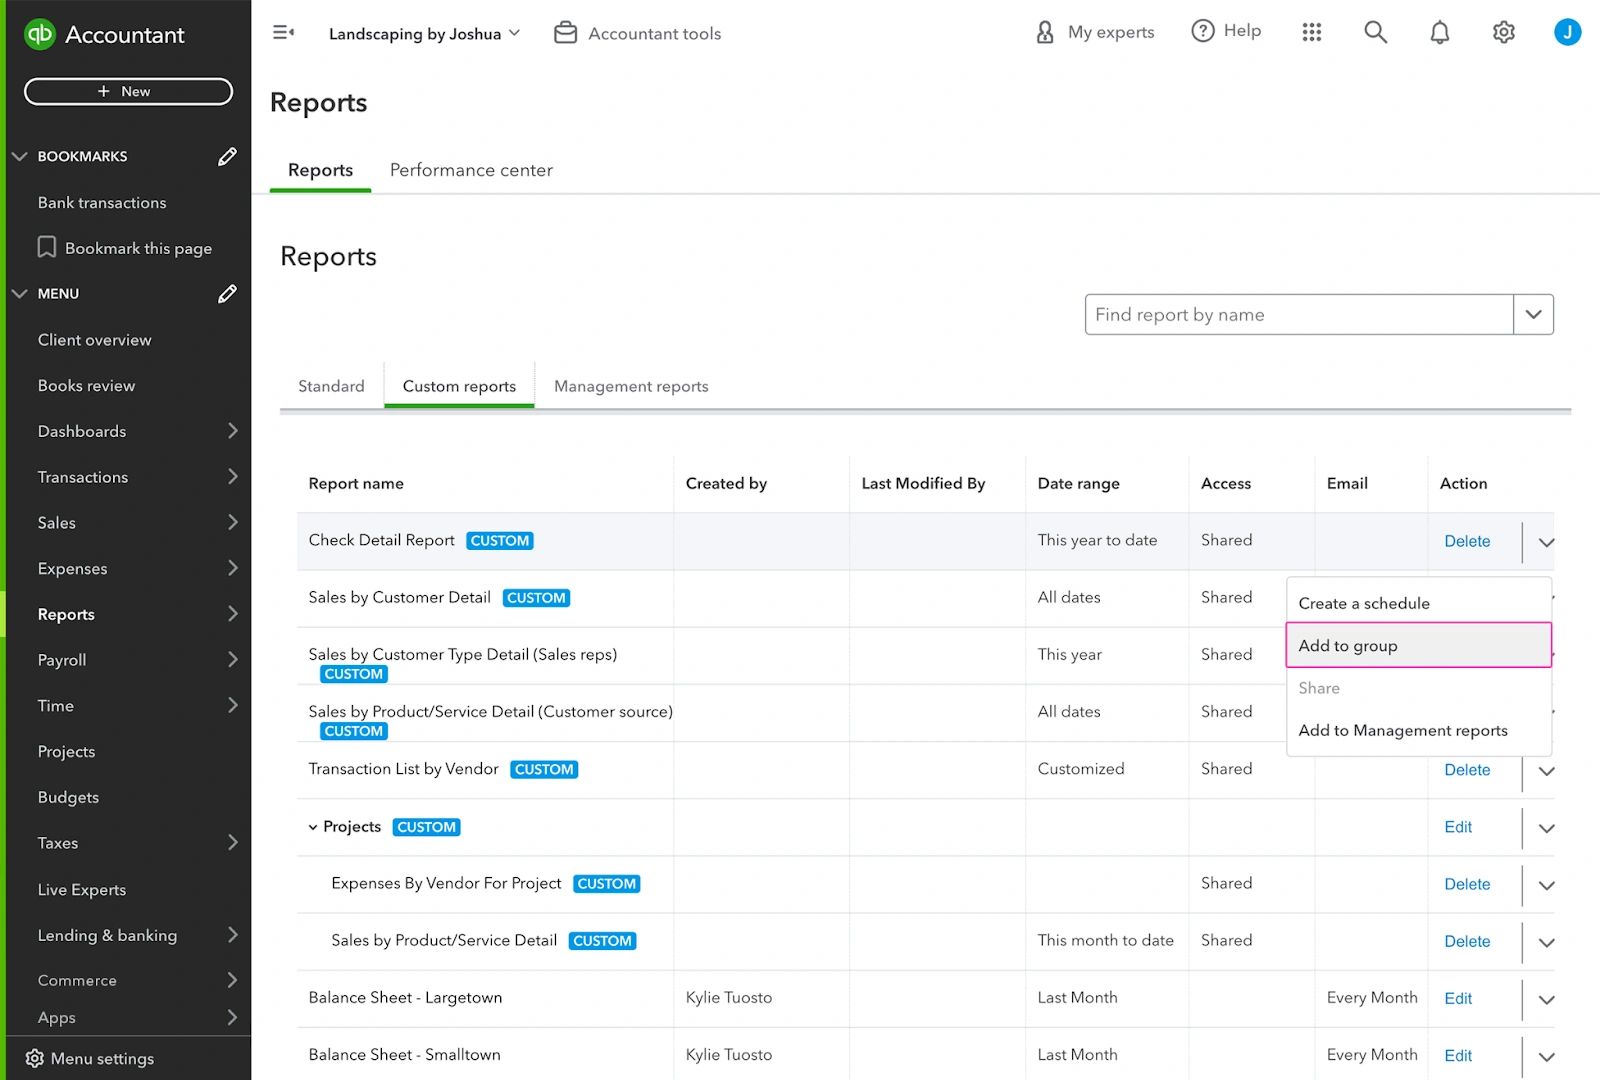
Custom reports can be structured into groups to make them easier to find and allow you to quickly create a PDF containing connected reports. Reports can also be scheduled from the Custom reports bar, or from within the report itself, as you’ll see shortly.
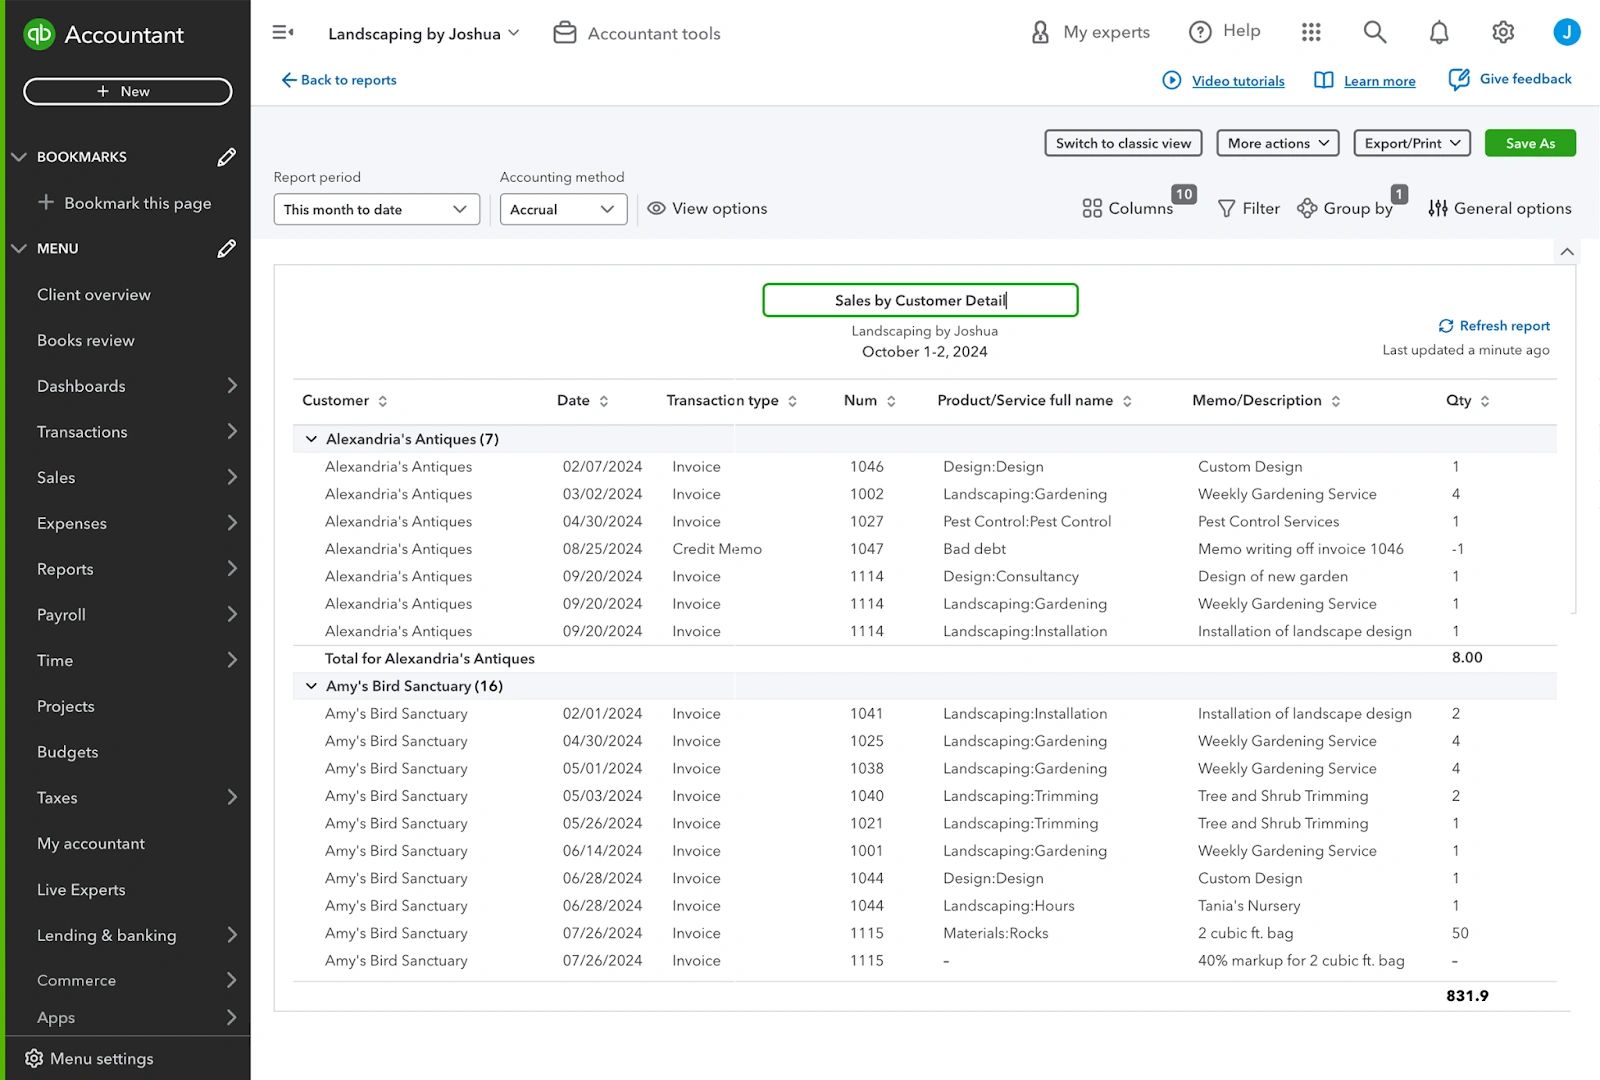
You can create custom reports by opening any reports on the standard tab, making changes, and saving them. When doing this, it’s important to change the report title to something unique and meaningful, so you can return to it easily and it will be obvious to you what information they are looking at. Select the Pencil icon by the default report name to change this
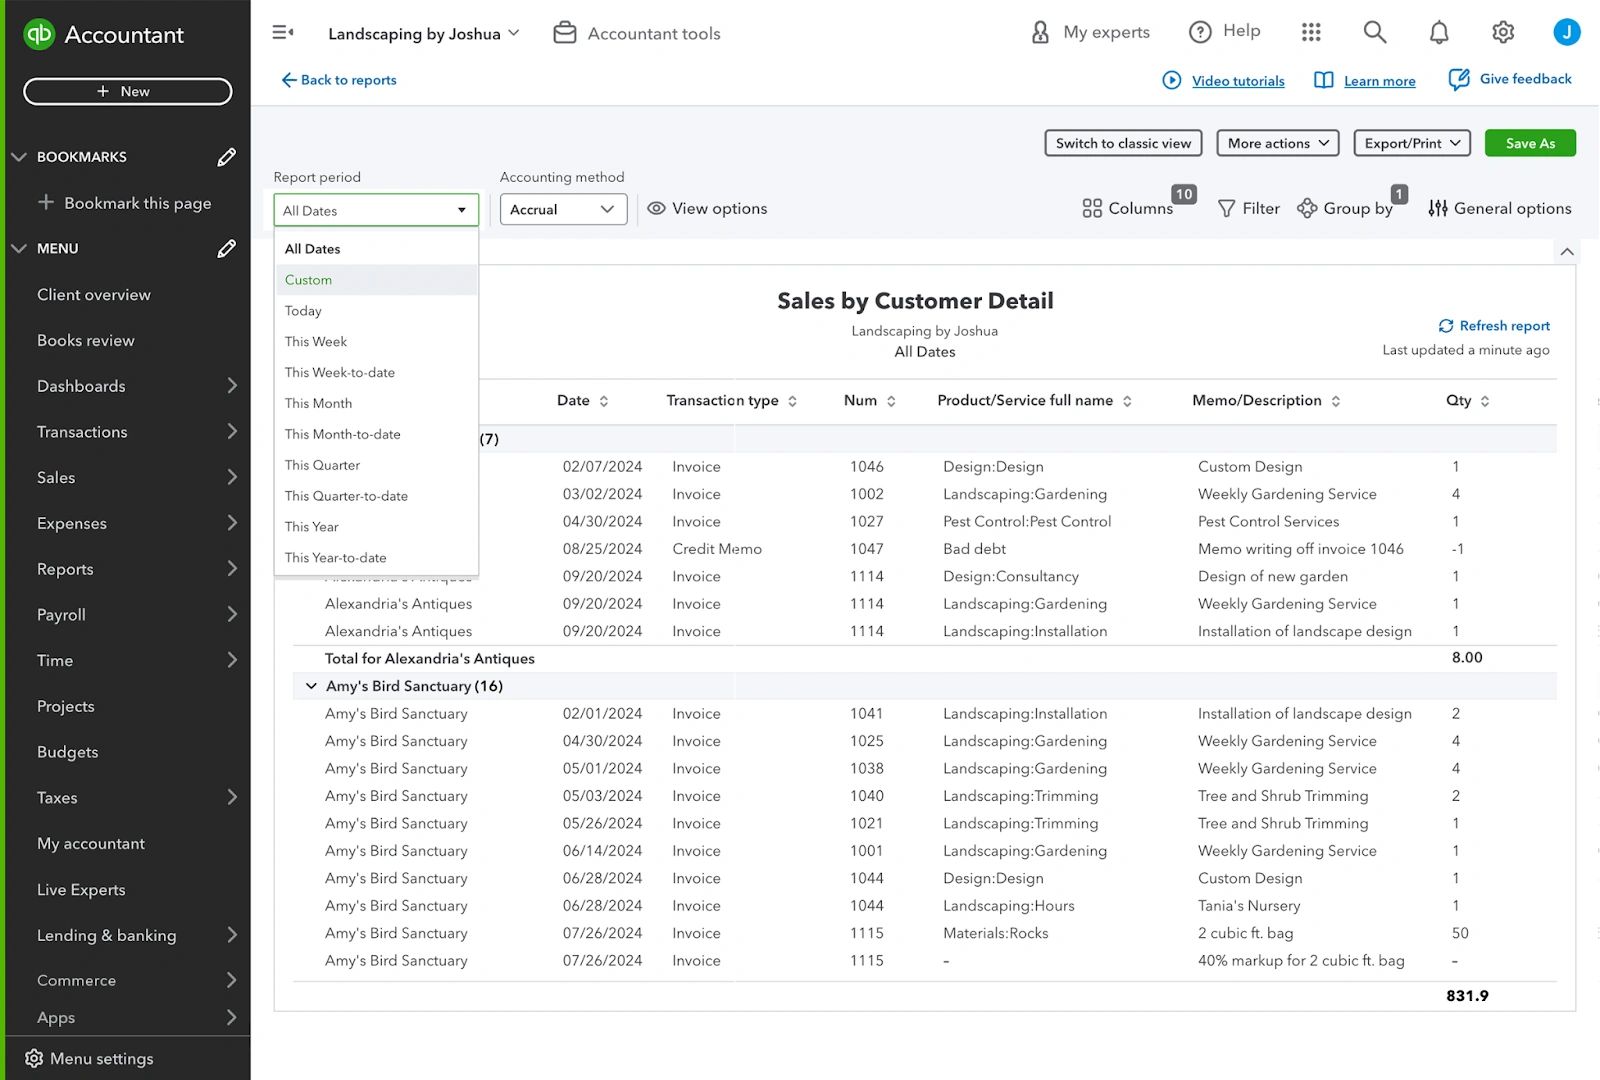
The date range of the report will be the default range set in Reports options in Accountant tools. However, you can change this in the Report period dropdown. Note: As you know, the balance sheet doesn’t present data from a given date range, just a point in time, this point in time is always the last date in the report period date range. Setting the date range on a balance sheet, changes the date range you will see if you drill down into any of the values on the balance sheet.
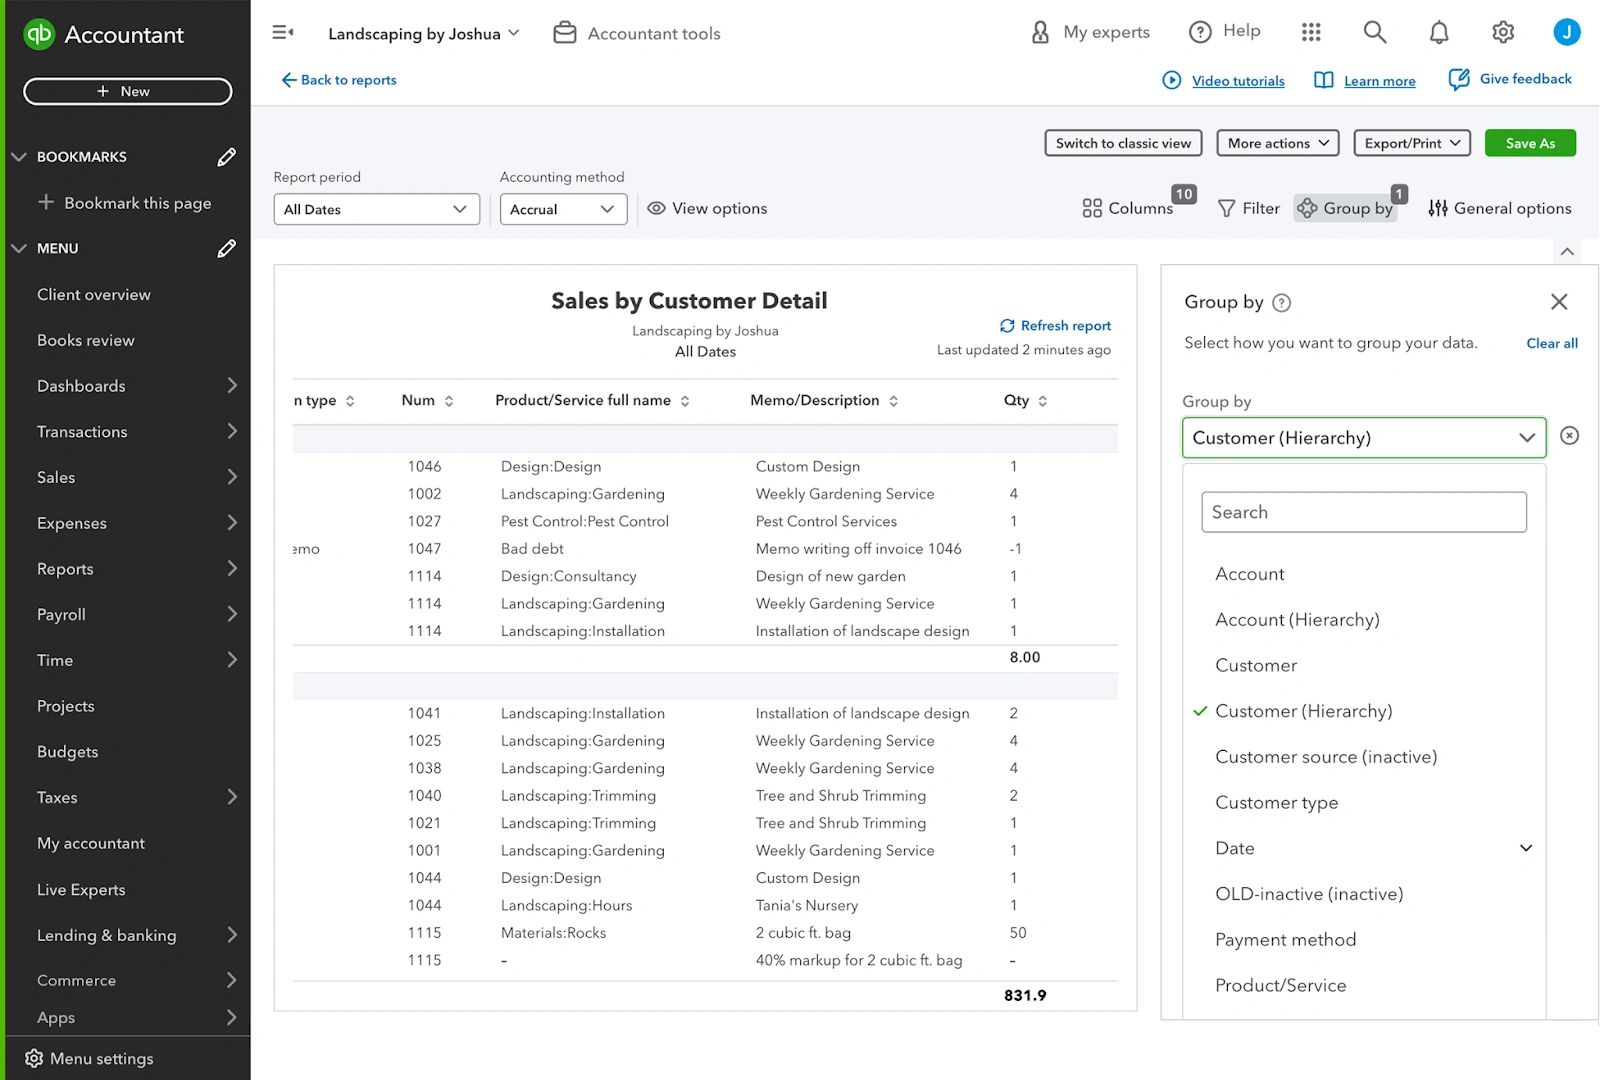
Standard reports open with predefined grouping and filters. These can be changed to show exactly the data you want in your report. Select Group by to change how the data in the report is grouped or subtotal. The grouping options will vary depending on the report and how your account is set up, but include custom categorization methods such as class and location, as well as other QuickBooks fields.
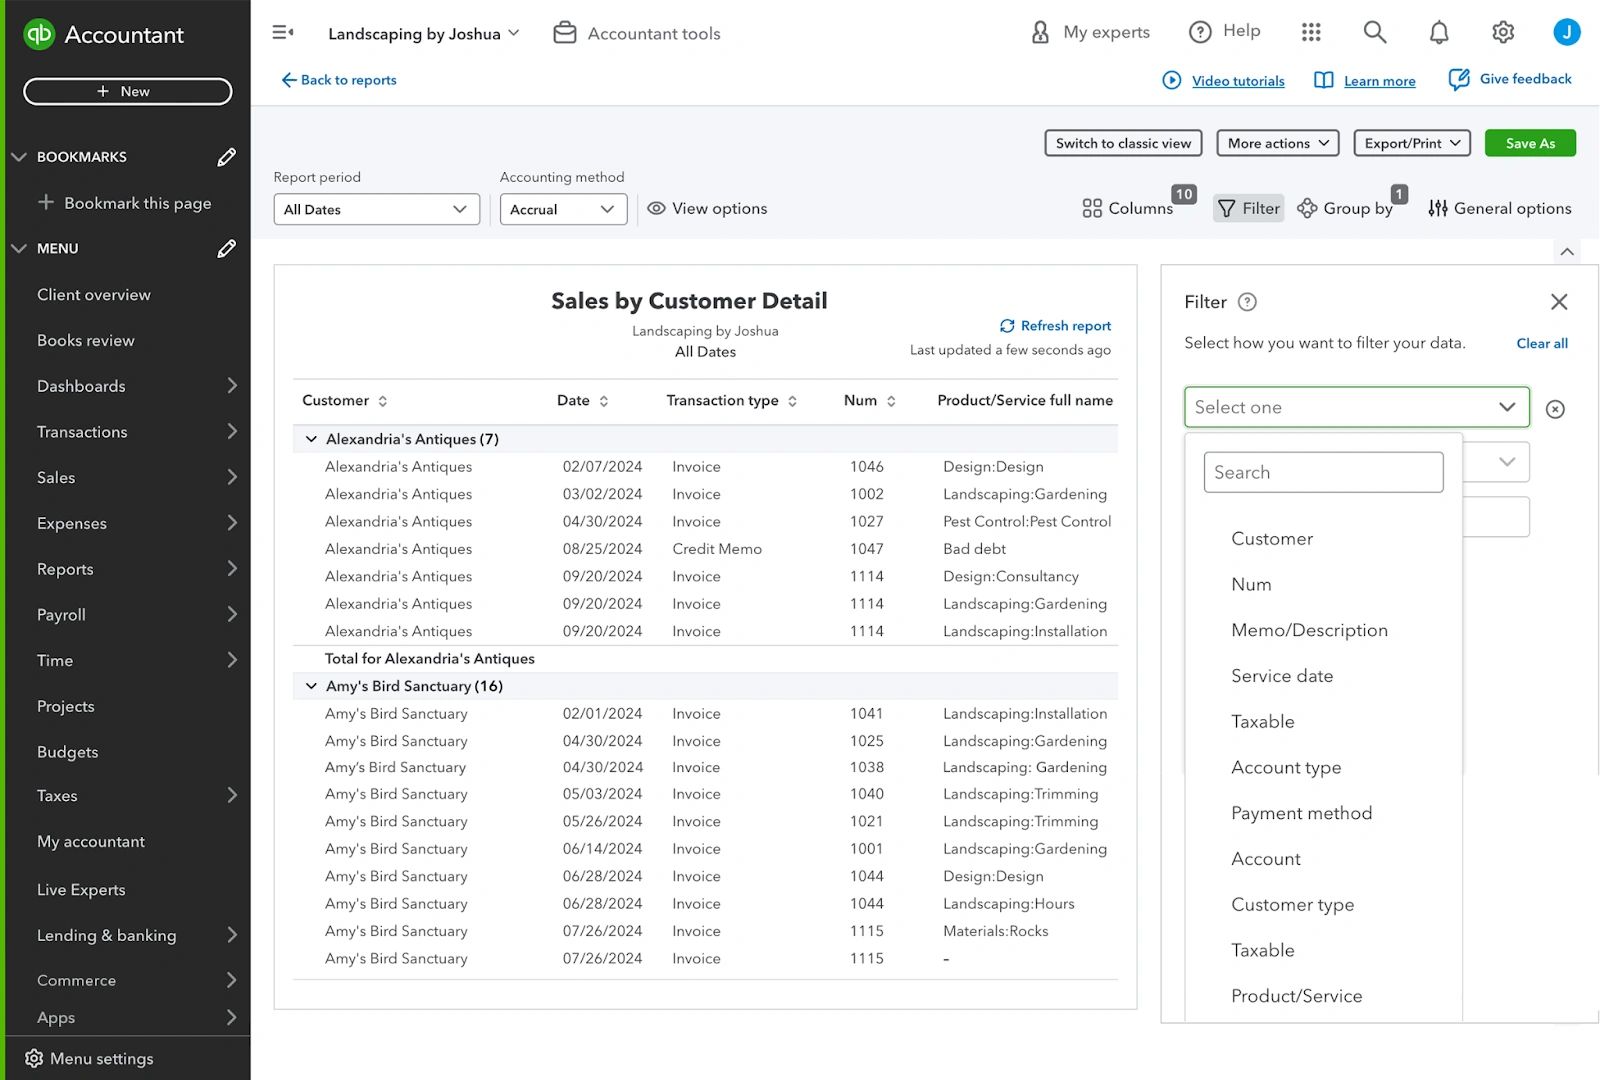
Select Filter on a report to choose which data appears in the report. For example, you can set a filter to show only the data for certain people or transaction types. Again, What you can filter by will depend on the type of report. When you’ve chosen what you want to filter the report by you can then set the filter options including the specific items to be included or excluded from the report. Once you have completed this filter information, the report will update automatically.
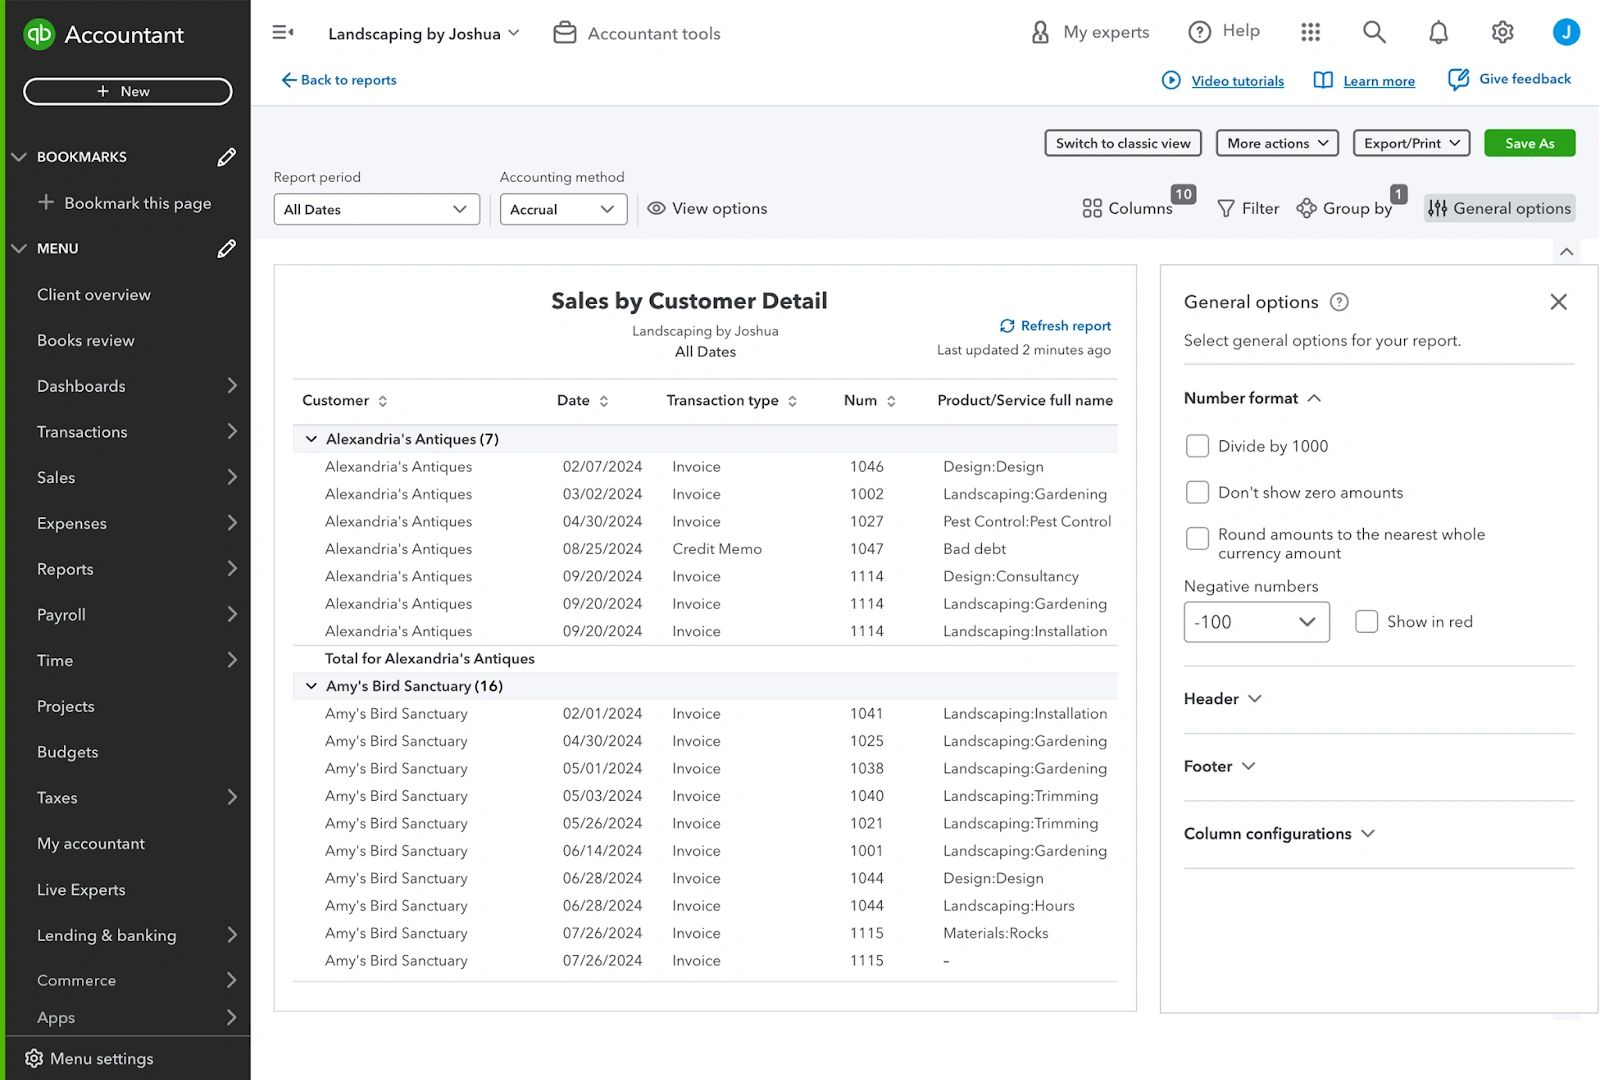
Select General options to determine how the report displays visually (for example, the number format, and details for the header and footer).
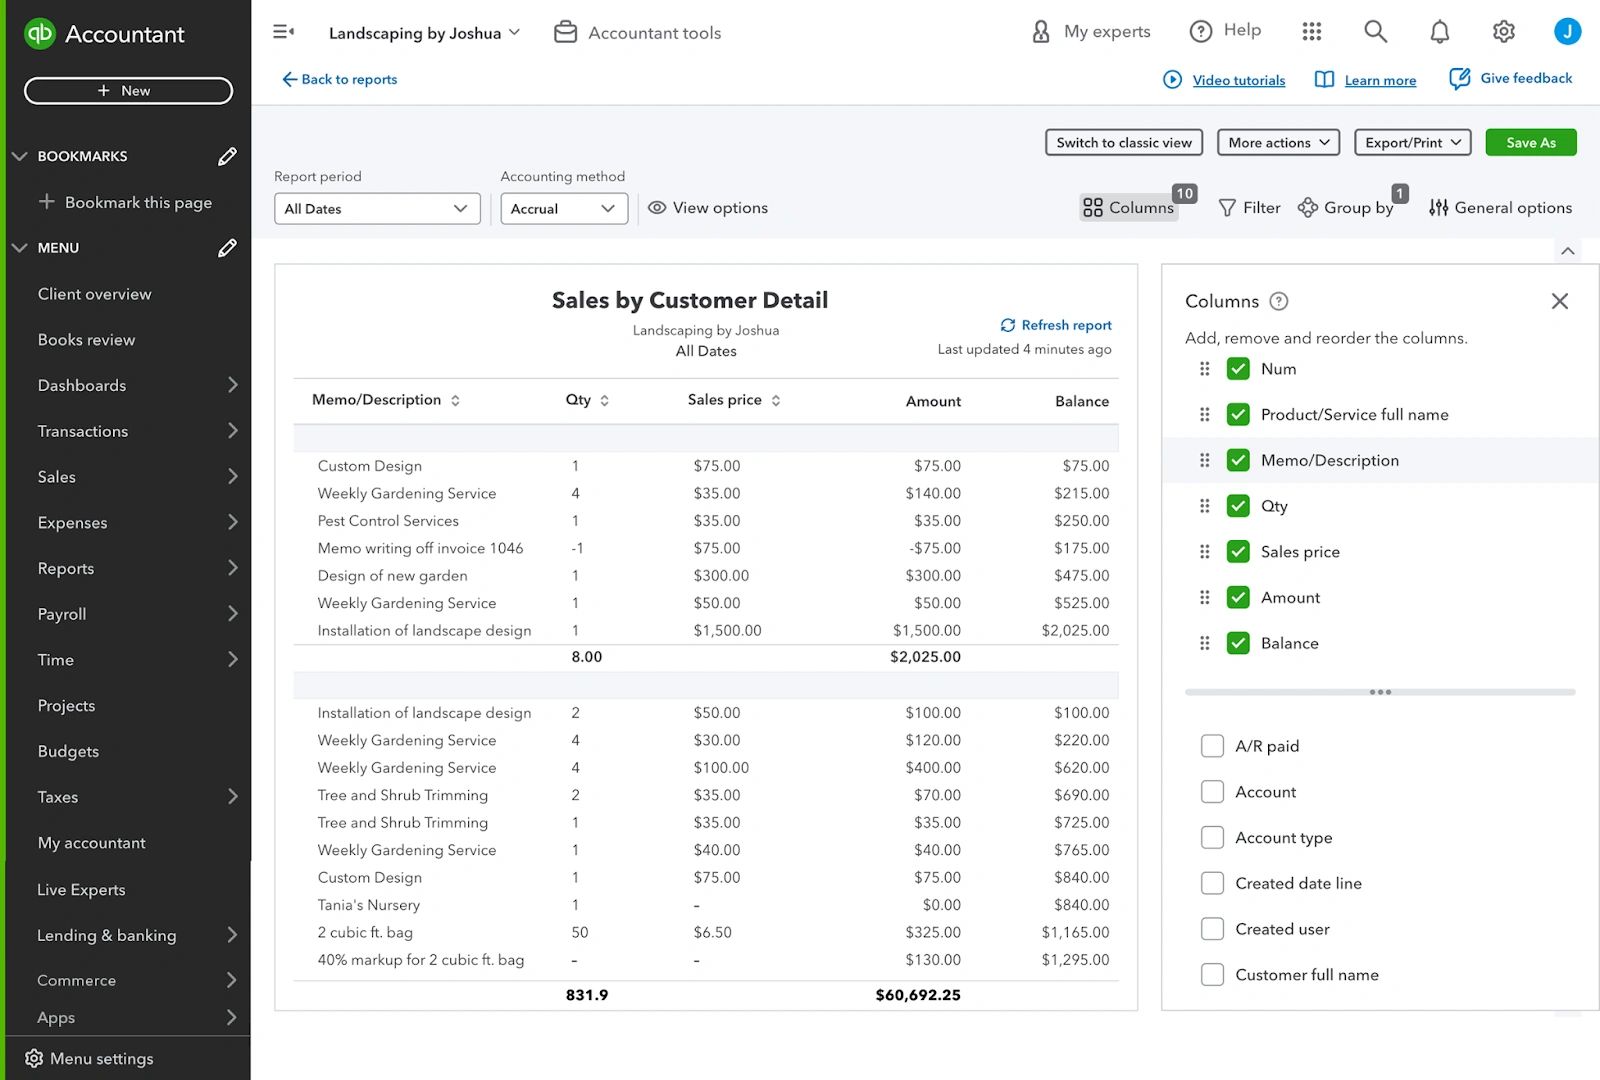
Select Columns to set which data columns should be shown in the report. This includes removing those you can already see, and adding additional columns not already included. As with other customizations, the columns that can be added will vary by report.
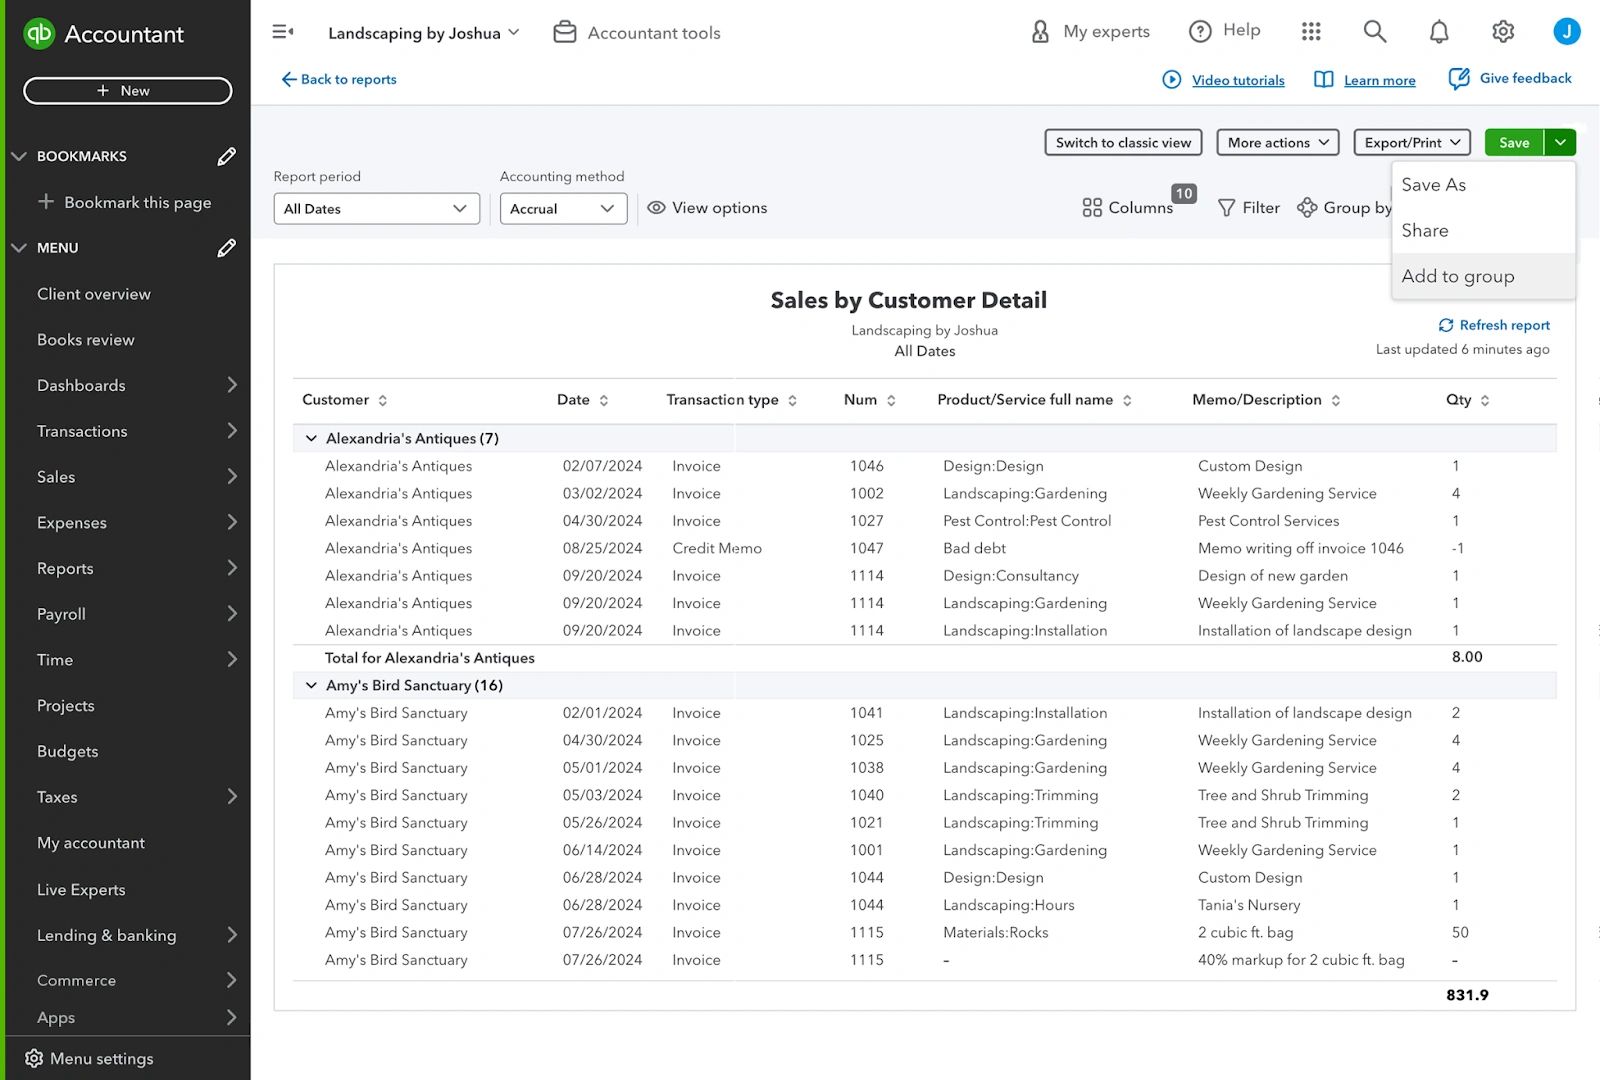
When you have finished customizing a report, don’t forget to save it. Once it is saved, you can make further customizations if needed. The Save options for custom reports will then include Save as-to create a copy, and Add to group-a quick way to add the new report to a group of reports.
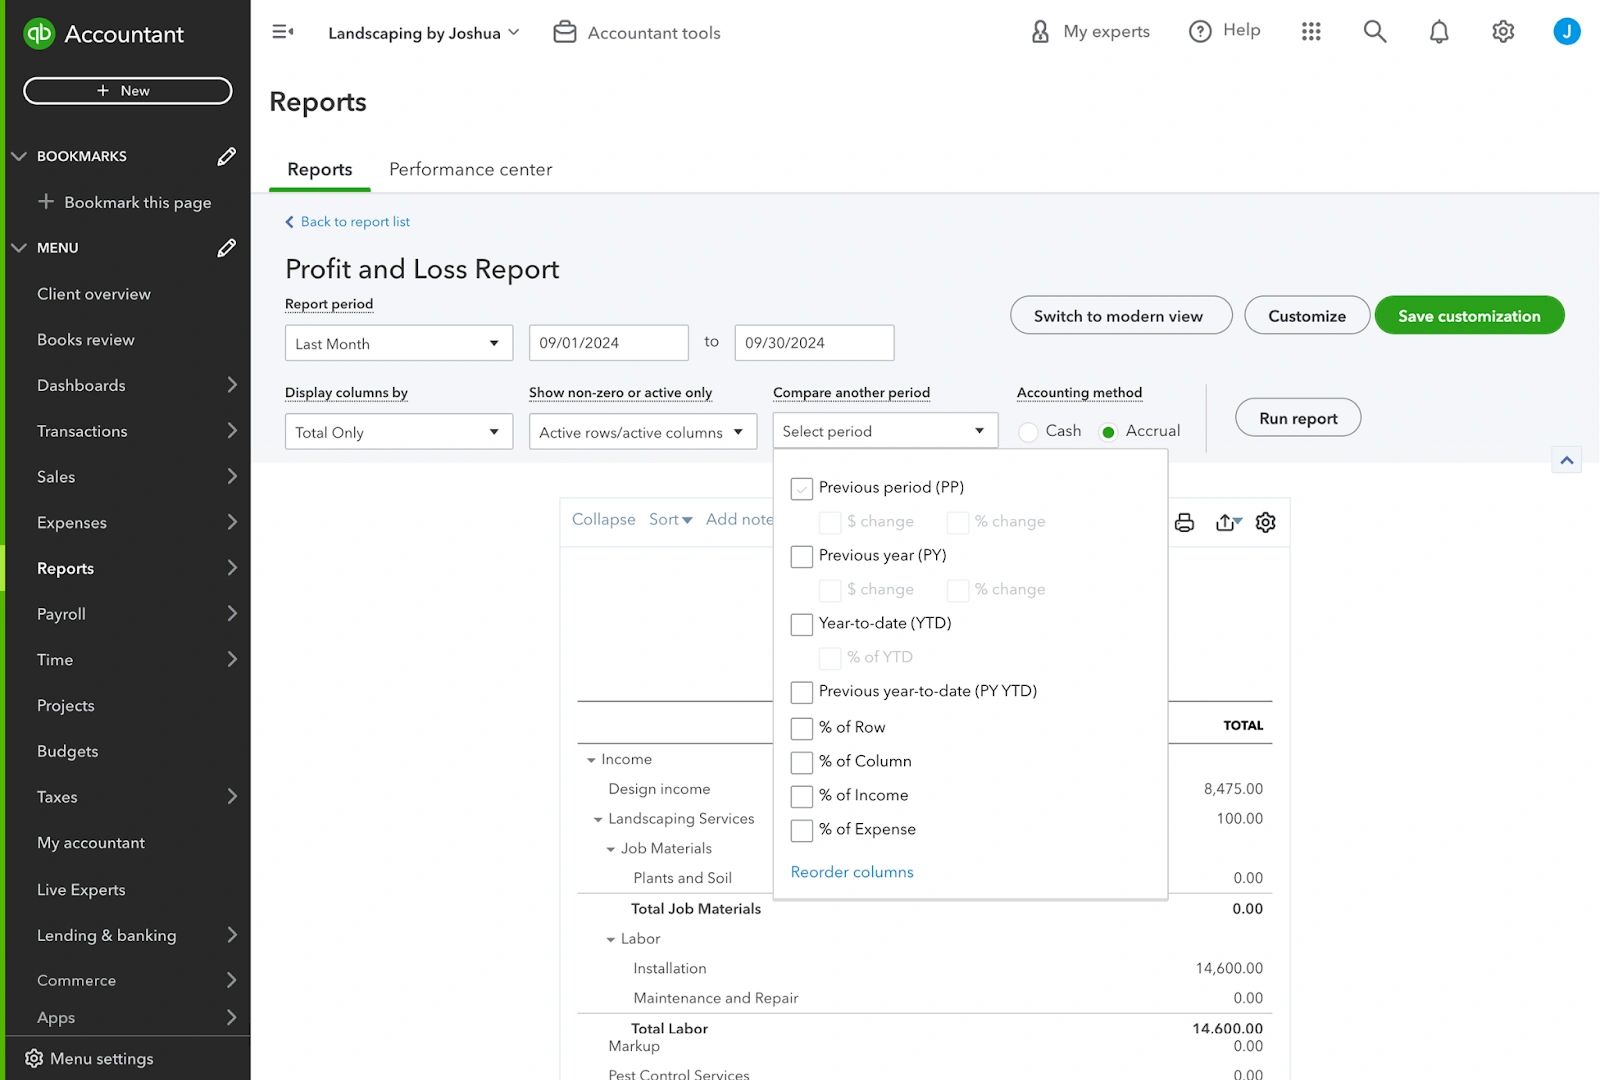
All customization options will vary depending on the report you are running. The profit and loss and balance sheet reports, for example, also include the option to compare the data in the report to another period. You can choose to compare data from the previous period or the previous year, and display the dollar or percentage change. Adding this data can help identify trends, measure performance over time, and uncover any mis-posting.
Classic and modern reports
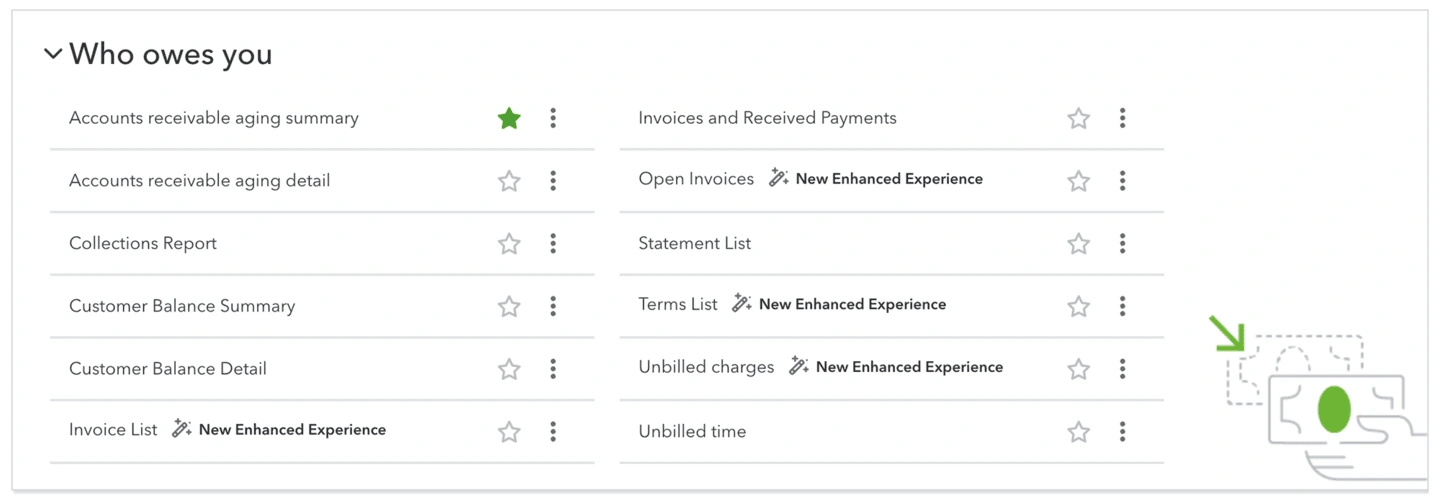
The Reports center is going through a refresh. You’ll see that many reports have the label New Enhanced Experience next to them. These reports use the new modern view for reporting. This is being introduced to make it easier for you to discover, create, analyze, and share. Modern view reports provide faster performance and additional customization options than classic reports. Over time, all reports will be moved to the modern view. While this upgrade is in progress, you’ll be able to switch between classic and modern views. Both classic and modern view reports allow for customizations and can be used to provide insights to you. This course focuses on the functionality of modern view reports, so please note that some features may work differently in classic reports.
Cash reports
Many reports in QuickBooks can be run using either accrual reporting or cash reporting, without the underlying data in your accounts being changed.
QuickBooks creates cash-basis reports by omitting unpaid accounts receivable and accounts payable transactions.
What’s different on a balance sheet run on a cash basis?
As there is no accounts receivable or accounts payable in cash basis accounting, when a cash-basis balance sheet is run, any accounts receivable or accounts payable balances will be zeroed by QuickBooks.
Any open bills or invoices that use a balance sheet account on the distribution line aren’t reflected in the target account balance.
One example is if you created a bill to record the purchase of a fixed asset, like equipment, or to pay the principal portion of a loan. Another example is if you used an invoice to record a deposit or prepayment on a job, or used items mapped to an asset account, such as inventory or work in process. The cash-basis balance sheet would not account for these transactions in the asset/liability account, or the accounts payable or accounts receivable accounts.
What’s different on a profit and loss report run on a cash basis?
Only income received and expenses paid appear on a cash-basis profit and loss statement. The statement doesn’t include amounts in the distribution lines for unpaid bills or invoices. QuickBooks uses the Paid status on a transaction, as of the reporting period, to determine whether to include the transaction in the cash-basis report. Sales receipts and expenses are considered as paid, so are included in cash-basis profit and loss statements.
How are credit card payments treated in cash-basis reports?
In cash-basis reports, QuickBooks treats transactions recorded to a credit card liability account as if they were paid by cash. (This can be hard for someone to understand, but think of it this way—even if you haven’t yet paid the balance of your credit card, the payee has received their payment, and from that perspective, it is the same as a cash transaction.)
In these situations, QuickBooks does not reverse the entries like it does with the accounts payable balance. The cash-basis balance sheet shows a balance in the liability account, and the expenses paid by the credit card are included in the cash-basis profit and loss.
A good way to remember this is that the profit and loss will always include an expense-type transaction, regardless of the report’s basis (cash or accrual). However, a bill will always be reversed on a cash-basis profit and loss.
If you have entered a bill to reduce the credit card liability account—but the bill hasn’t been paid when a cash-basis report is run, QuickBooks displays the amount of the bill in the Unapplied Cash Bill Payment Expense instead of reversing it against the credit card liability account.
In this case, if you file taxes on a cash basis, they’ll need to make an adjustment outside of QuickBooks for the relevant amount to be reflected correctly on the tax return. If this happens often, you may want to advise to leave the amount owed in the credit card liability account rather than create a bill. That way, there’ll be no reversal against Unapplied Cash Bill Payment Expense.
Do transaction dates make a difference in cash-basis reports?
The transaction date can impact cash-basis reporting. If a customer payment is received earlier than the invoice date, the payment is shown as Unapplied Cash Payment Income when the report is generated for a date before the invoice date. Also, the inventory adjustment to the cost of goods sold is not recorded in this report because the invoice records it, and the report is dated earlier than the invoice.
The same is true for a bill payment if it is dated earlier than the bill it is applied to, and the cash-basis profit and loss is dated sometime between the bill payment and the bill date. In this case, the bill payment is shown as Unapplied Cash Bill Payment Expense.
Cash-basis reports and unapplied cash
When working with cash-basis reports, you might see some accounts on the profit and loss statement that you don’t immediately recognize. These accounts are created by QuickBooks to handle any unapplied payments and to adjust the accounts receivable and accounts payable accounts to zero. Because they are used to allow QuickBooks to switch between accrual-based and cash-based reporting, these accounts can’t be adjusted.
The Unapplied Cash Payment Income Account
When you record a customer payment via the Receive Payment screen and don’t apply it to an invoice, the cash-basis profit and loss will report it as Unapplied Cash Payment Income.
In these cases, QuickBooks:
- Debits accounts receivable (A/R), and
- Credits Unapplied Cash Payment Income
The Unapplied Cash Bill Payment Expense Account
If there’s no bill associated with a bill payment transaction, or if an expense or check is posted to accounts payable, the cash-basis profit and loss will report this as Unapplied Cash Bill Payment Expense.
In these cases, QuickBooks:
- Debits Unapplied Cash Bill Payment Expense, and
- Credits accounts payable (A/P)
Different Plans, Different reports
Depending on your QuickBooks plan, there may be different reports available to it. Check out this comparison chart to see which reports are available in the different plans. When working on reports for QuickBooks Online Advance, you’ll also have access to further features, such as Spreadsheet sync, creating custom reports, and viewing reports as charts rather than tables.
Sharing reports
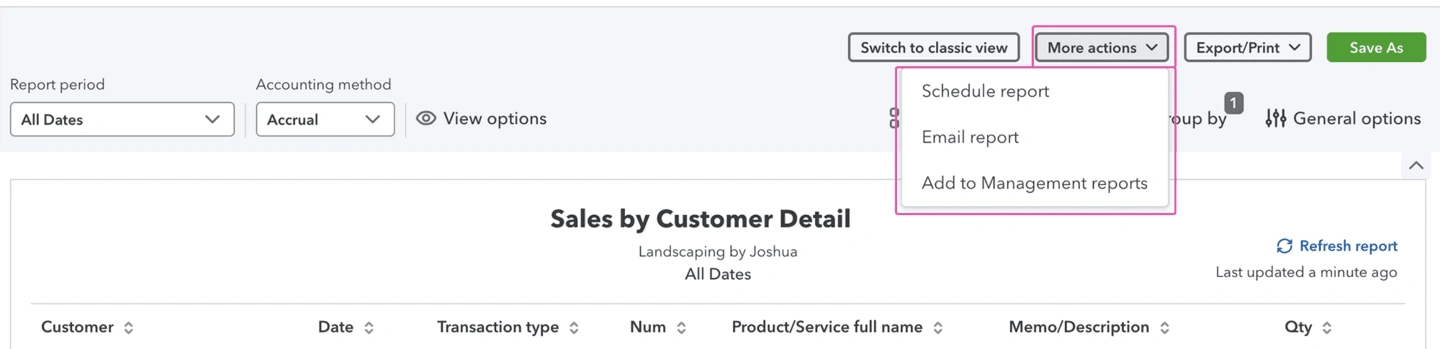
Selecting More actions on a report will give you access to different options for sharing a report with people. Depending on the report, these options will vary, but will be some or all of: emailing, adding to a management report, and scheduling.
Emailing reports and adding to management reports
Let’s start by looking at the first two: how to email a report to you, and how to add a report to a management report.
To email you a single report, select Email report in the More actions dropdown. You can then add the email addresses of the people you’re sending the report to. This is sent from QuickBooks, so it can be a good idea to copy yourself in, so you have a record of it, and it’s easy for them to respond to you via email.
You have the option of sending the report as an Excel, CSV, or PDF. When selecting a format, consider how the document will be used by the recipient. If it’s just for their information, or they’re likely to be reviewing it on a phone, PDF might be best. If they will be working with the data, or adding notes to it, Excel or CSV might be more appropriate.

Scheduling reports
Now let’s look at the third option in the More actions dropdown: Schedule report. This allows you to schedule reports to be shared regularly with you.
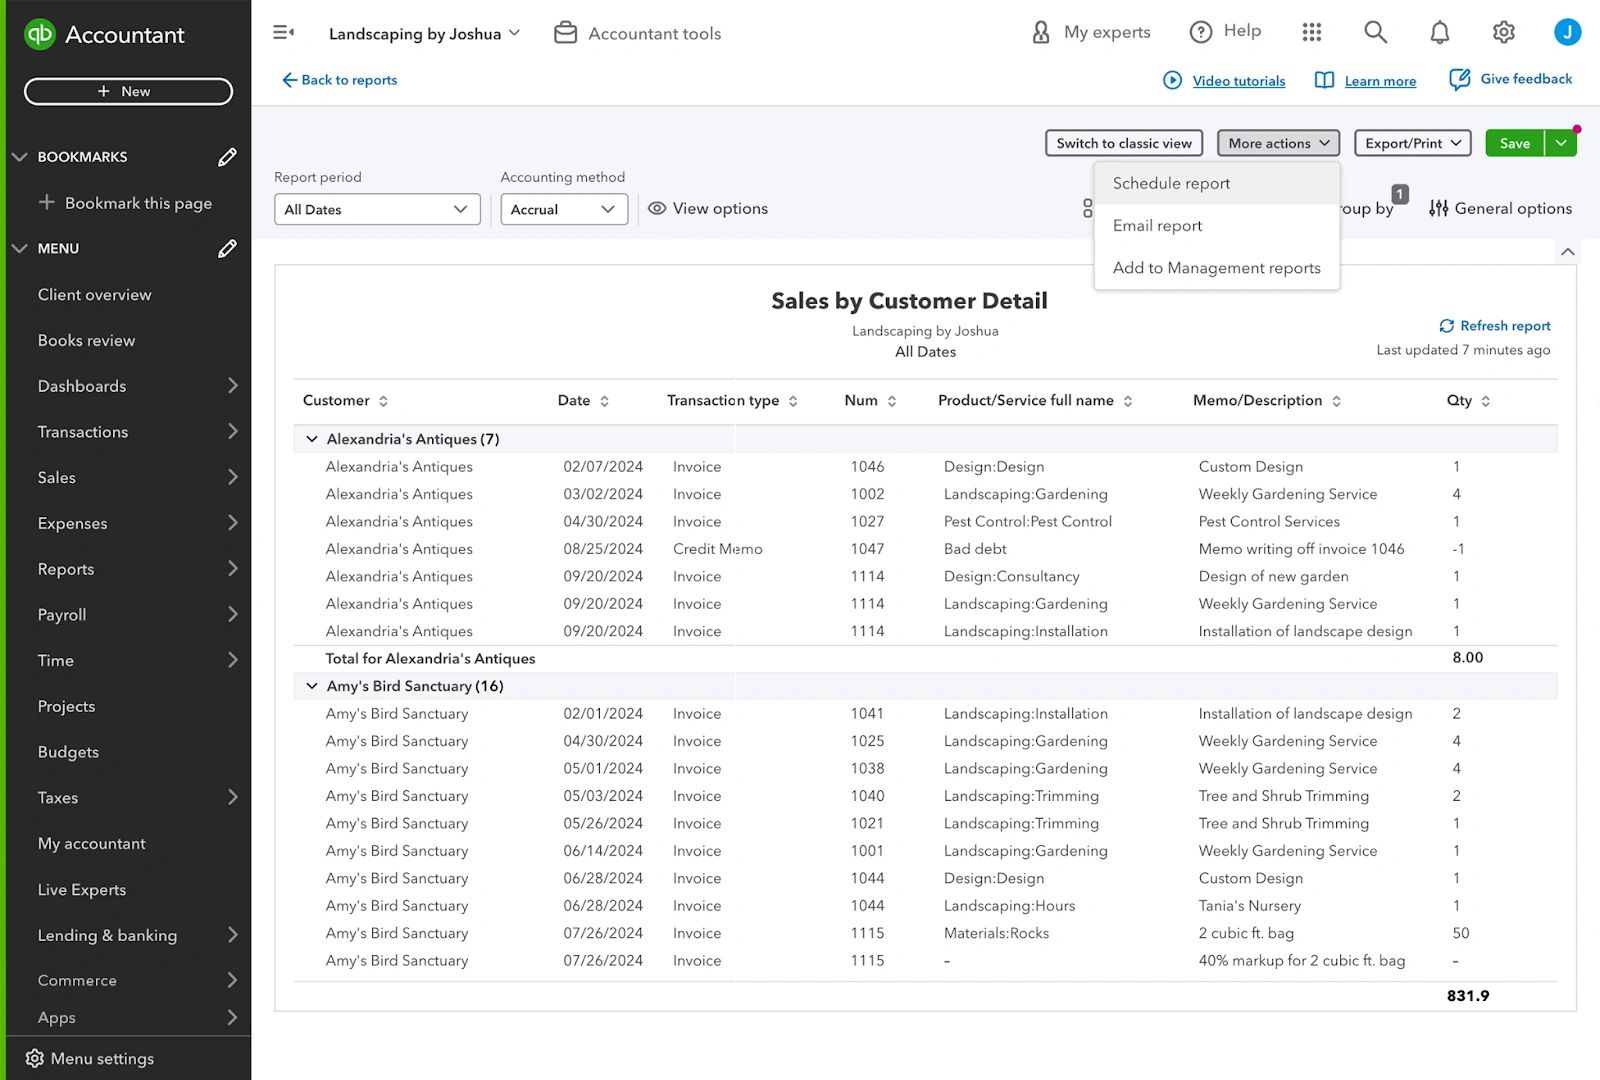
From within a report, select More actions, then Schedule report.
Make sure that the Report period is dynamic (for example Last month, or This year to date) rather than using custom dates ( such as 09/01/2024 to 09/30/2024), so that new data is included in the report each time it is shared.
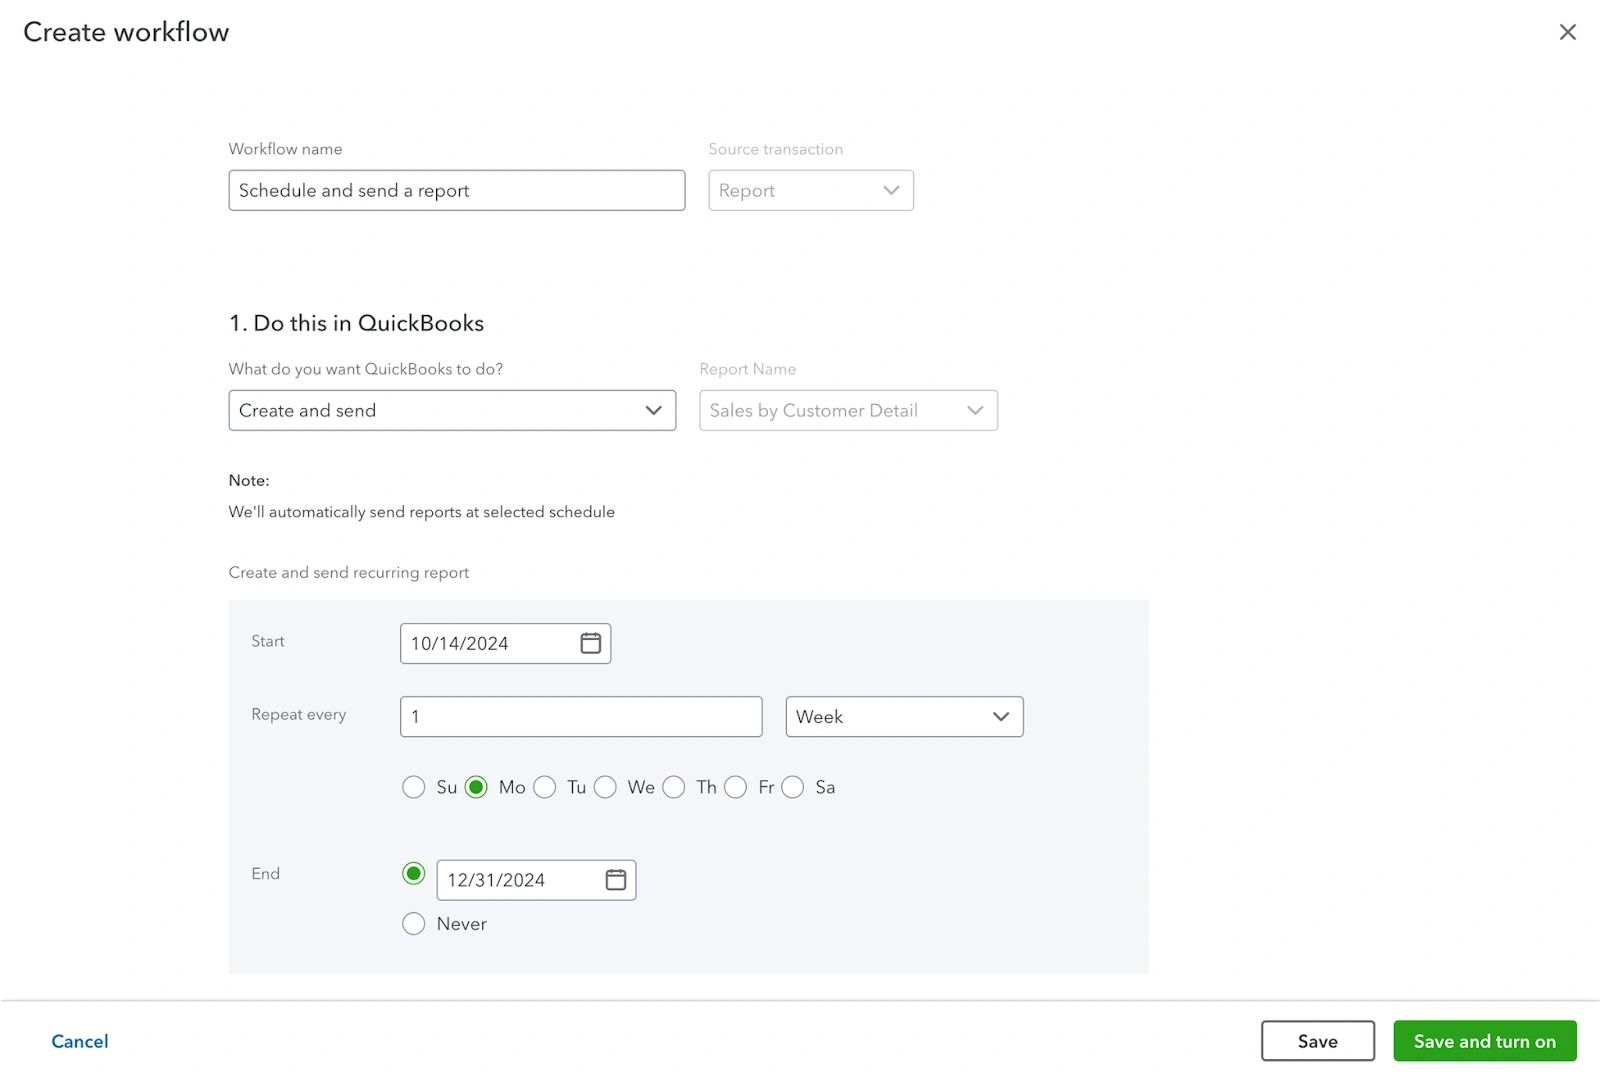
Set when you want the first report to be sent, and how frequently it should be scheduled after that.
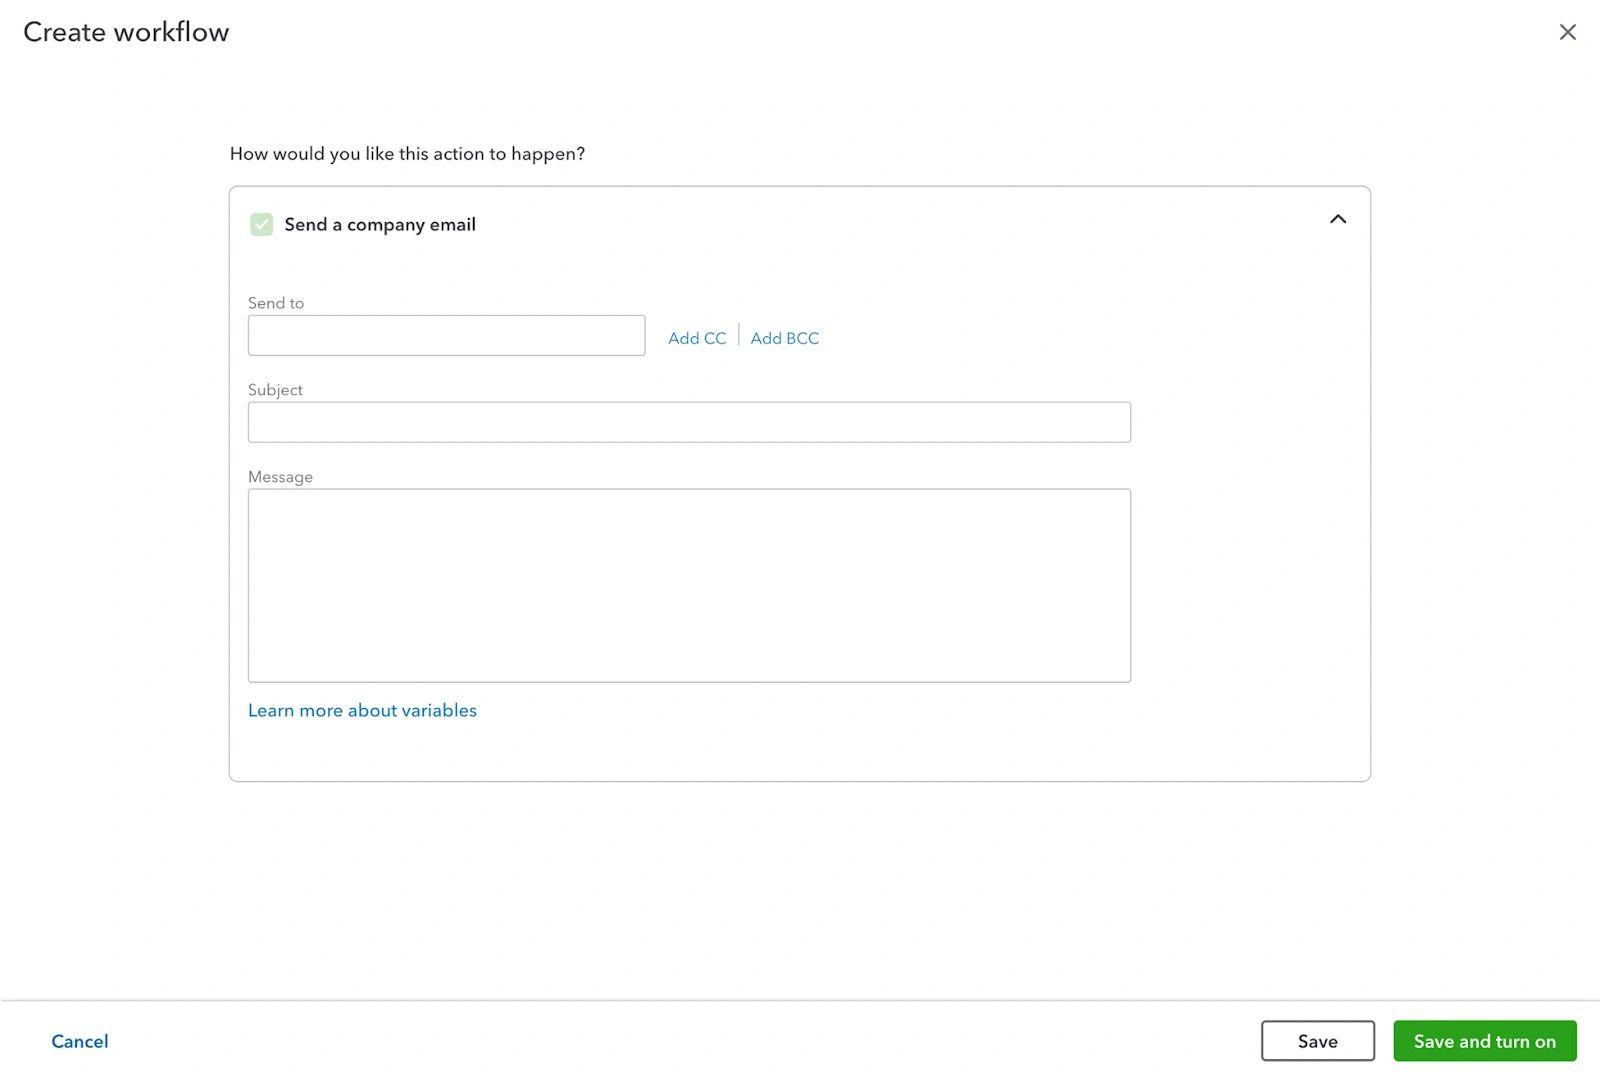
You can then enter the email address of who should receive the report (it’s a good idea to copy yourself in too) and write a covering note.
Remember this text will be the same each time the report is sent so avoid mentioning dates or writing things like “ please see attached for January’s sales figures” A message such as “ please see the latest AR-happy collecting!” could be suitable when sending an accounts receivable report, as it doesn’t specify a time period.
When you’ve filled out these details, select Save and turn on to finish creating the schedule. The email will then be sent to the recipients on the dates you specified. All reports sent this way will be attached as Excel files.
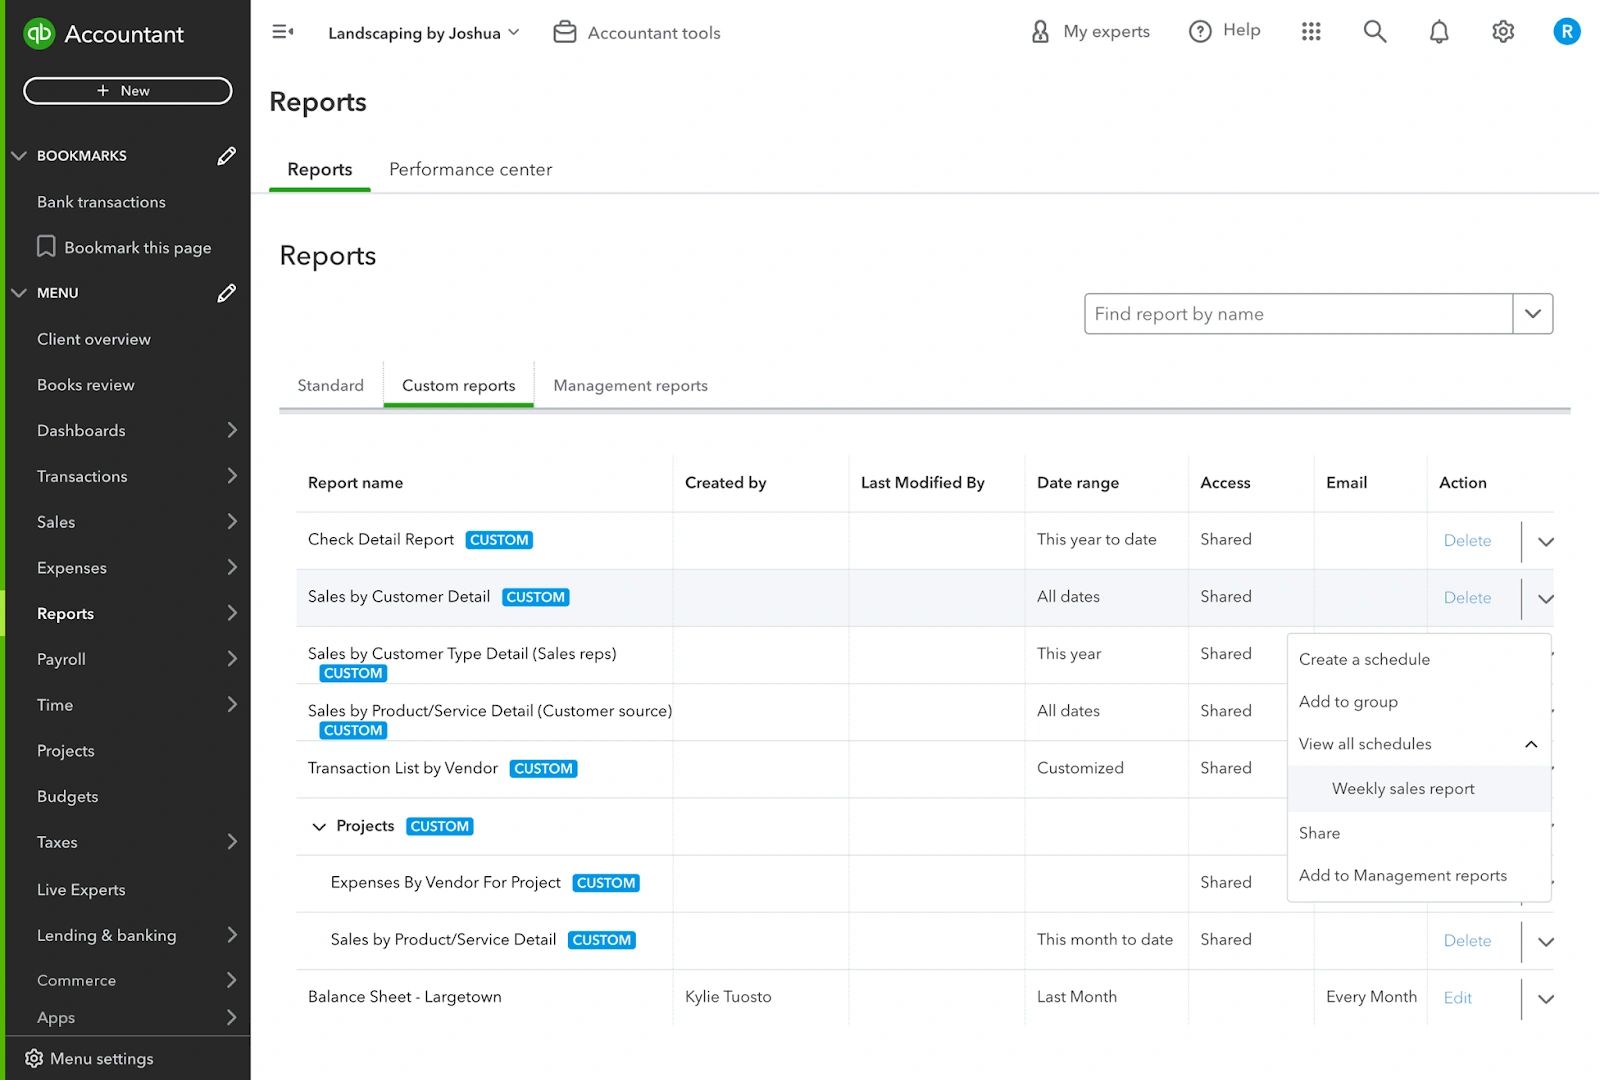
In the Custom reports tab, select the dropdown menu in the Action column to view any existing schedules. Select the name of the schedule to edit it. You can also create new schedules from here.
Note: When scheduling reports for QuickBooks Online Advanced, reports schedules can be viewed and edited in the Workflow center.
When to use scheduled reports
Scheduling reports is useful for operational reports that you use on a regular basis to inform their work.
For example, if a sales manager wants to see a report of all sales over the last month, or someone in the finance team wants a weekly view of accounts receivable so they can chase payments.
It should be used more judiciously with financial statements, which usually require some preliminary work to be done before sharing, as the scheduled reports will be sent regardless of whether this work has been done!
Using the Performance center
As a user, you will also see the Performance center in the Reports center of your accounts. This is another great source for providing insights to you. You won’t see this yourself, unless you have the QuickBooks Online Advanced plan.
Overview
The Performance center contains customizable charts that can be shared with you. This is a great way of visualizing financial data in a way that you might find easier to digest than full reports.
Charts can:
- Help you quickly see what’s happening in your business
- Enable you to recognize trends that impact the financial health of your business
- Help you to monitor the KPIs that matter the most to them, when customized
Depending on the type of chart, it may be possible to apply filters and compare data with a previous period. Depending on your industry and location, charts are available to compare your net profit margin and gross profit margin with other businesses in your industry. This comparison information is pulled from at least 30 businesses that are the closest match to your industry (as set in the Company information in Account and settings), revenue range, and location. These comparisons can provide useful information for advisory conversations with you.
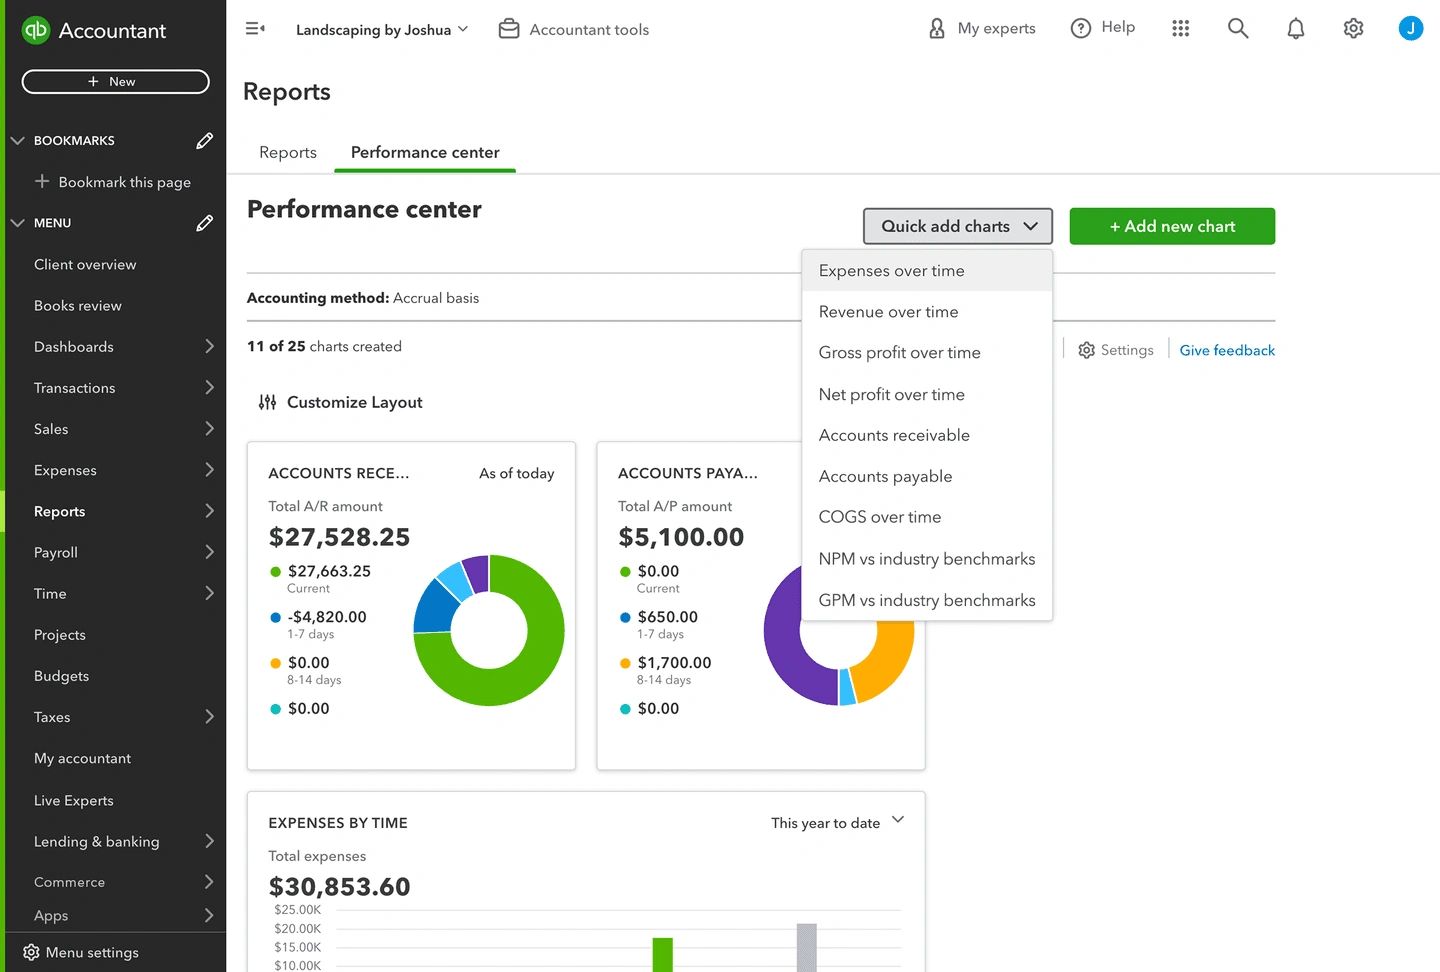
Sharing charts
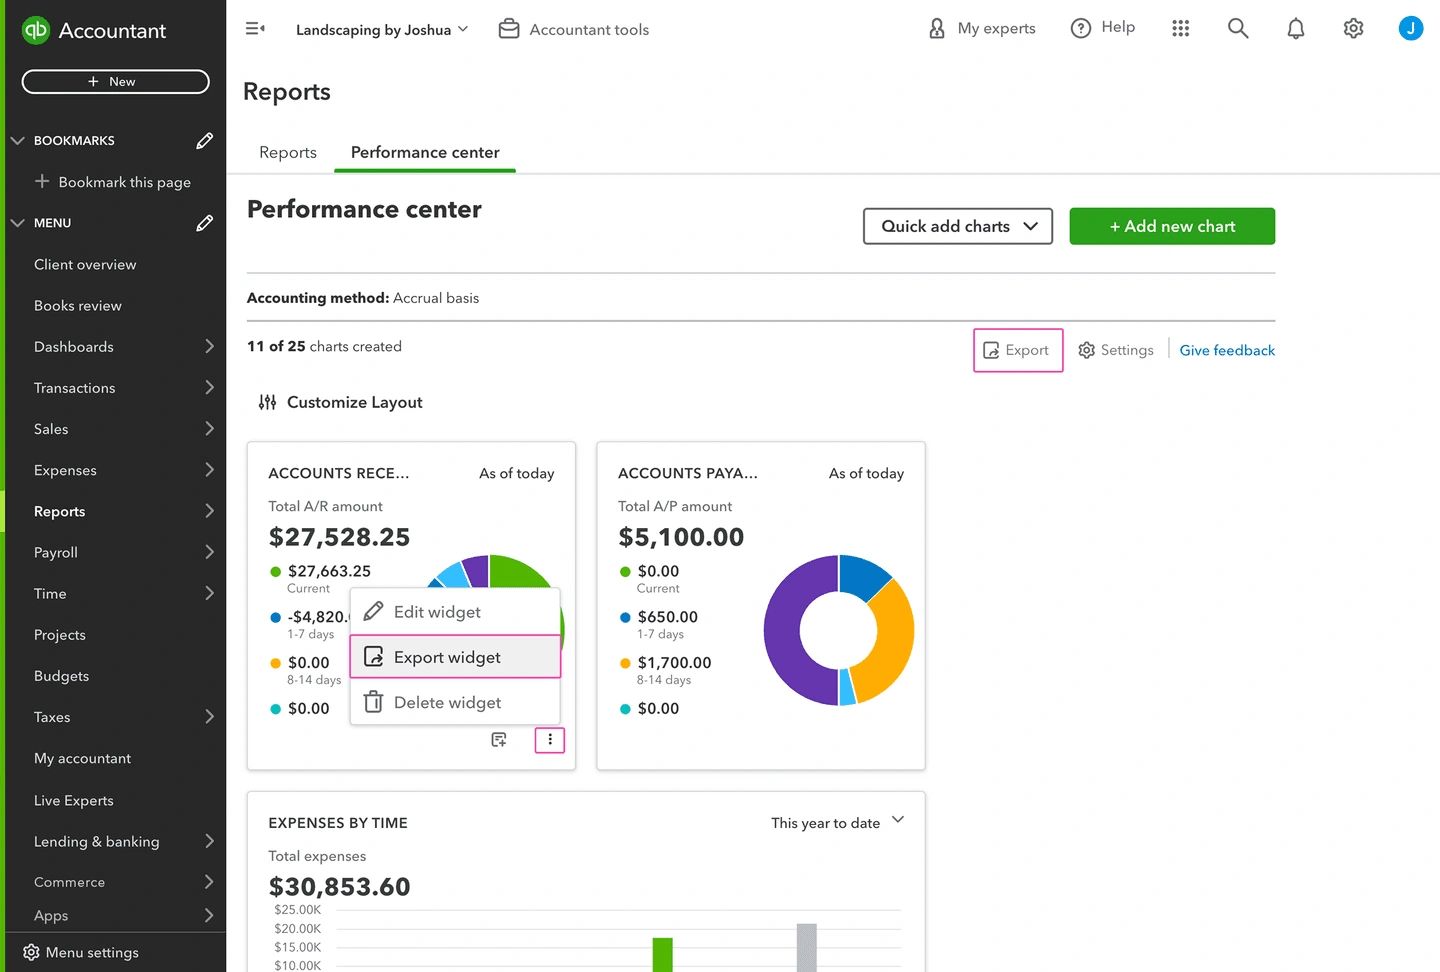
Charts can be shared with you individually, by selecting the three dot menu in the bottom right-hand corner of the widget. This creates a PDF of the chart that can be easily shared.
You can also export multiple charts at once. Select Export (next to Settings) and select the charts to be included in your exported PDF.
Example use of charts: Tracking sales performance
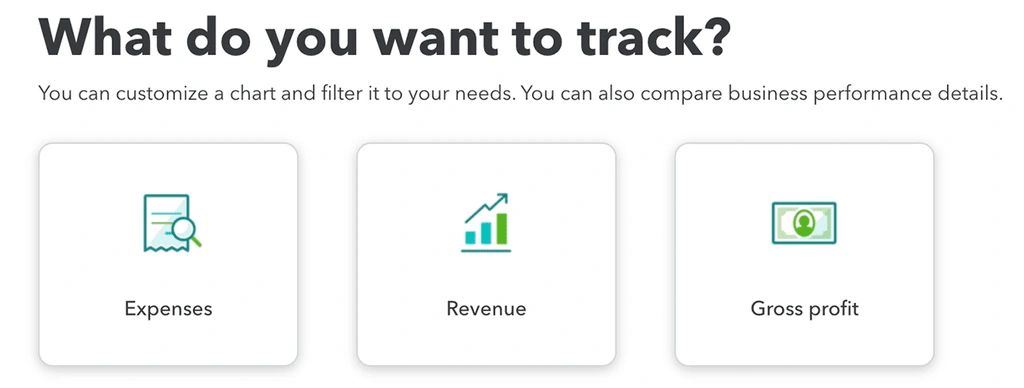
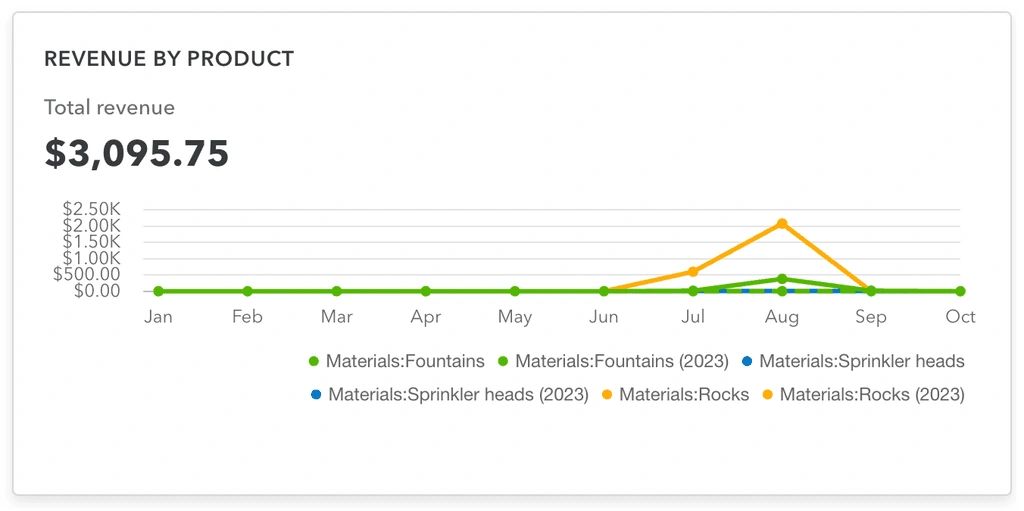
Let’s take a look at how the Performance center can be used to show the sales performance of different products. This could be used to help you compare how well different products sell throughout the year. They could then use this data to inform decisions, such as when to market certain products and if others should be discontinued.
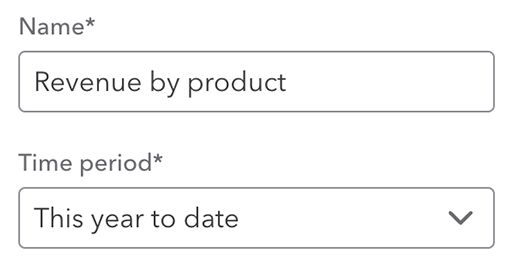
A unique name should be entered, and the time period should be set.
Then, in the Group by dropdown, Items should be selected, and the relevant items added.

Finally, Previous year’s same period should be selected in the Compare section, to set up a comparison to view the sales against the previous year.
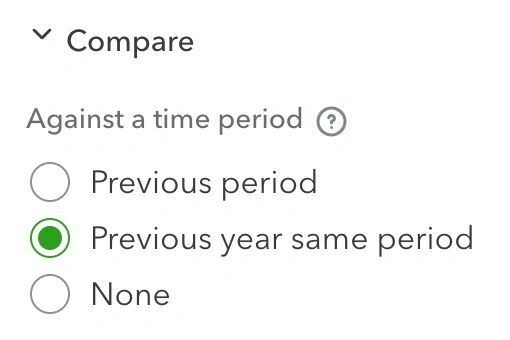
By following the above steps, you can create an easily understood, impactful chart for you to base their decisions on.
This can be shared with you, and added to the Performance center for future reference.
Using cash planning tools in QuickBooks.
QuickBooks Online has two tools to help you with your cash planning: Cash flow and Planner. These can be accessed by going to Dashboards in the left-hand navigation. These tools combine connected bank account data with information from other data within QuickBooks—and display it in meaningful visualizations. This gives you a more complete picture of their cash flow, to allow them to make informed commercial decisions.
Let’s start by looking at the Cash flow tab.
Cashflow
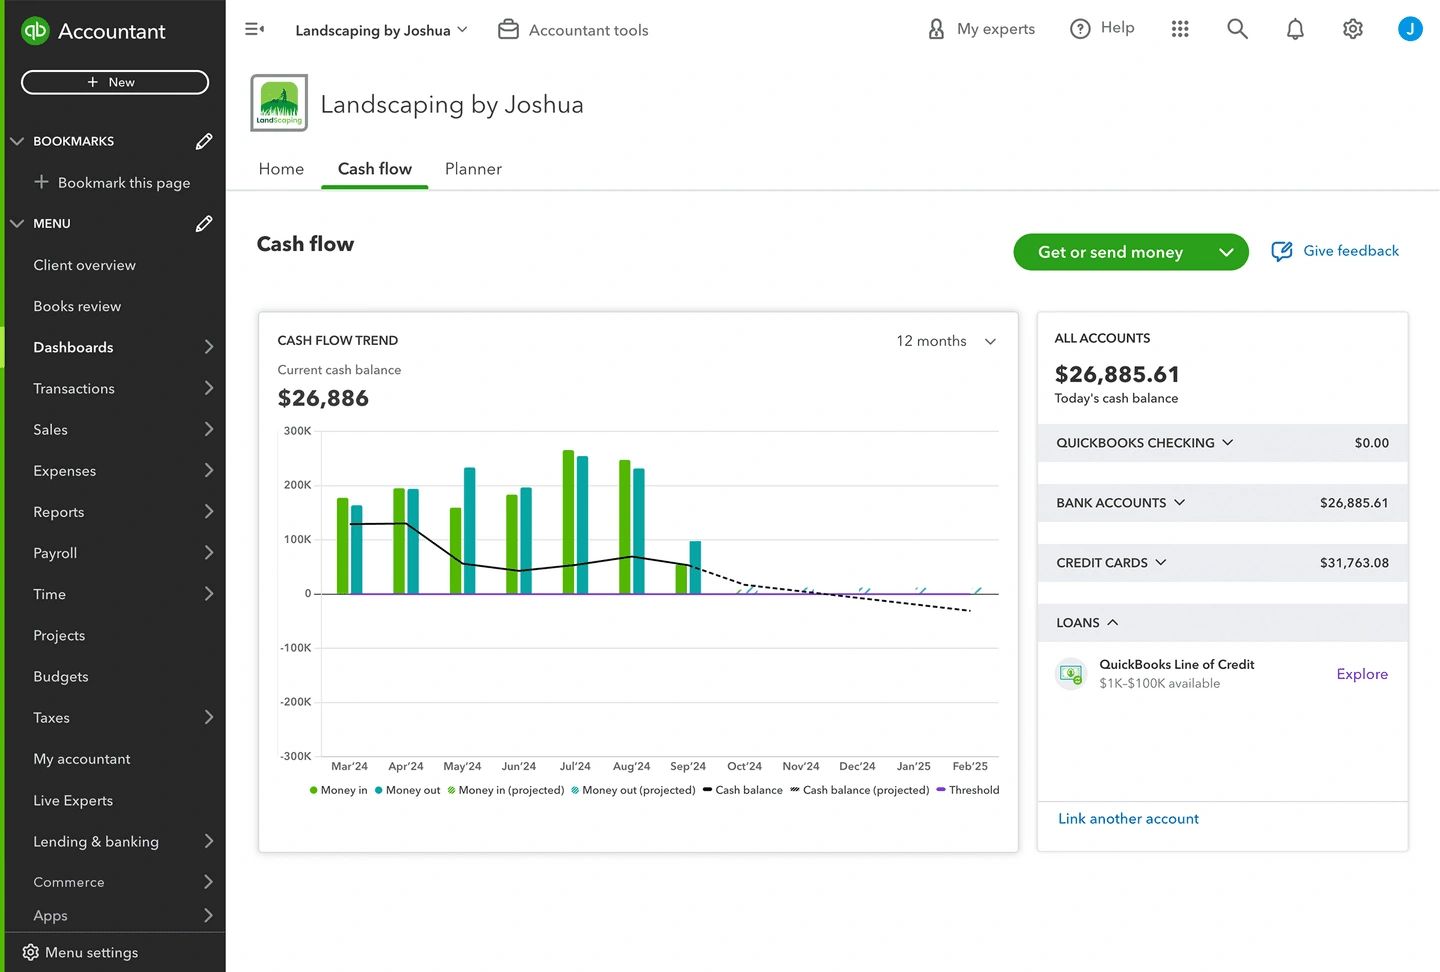
The Cash flow tab enables you to view cash flow for previous months—based on transactions in the bank feed, and the expected cash flow for upcoming months—based on the bills and invoices already entered into QuickBooks for that period. The Cash flow tab also lists all the connected bank/credit card accounts and their respective balances, including summaries of money in and money out.
Planner
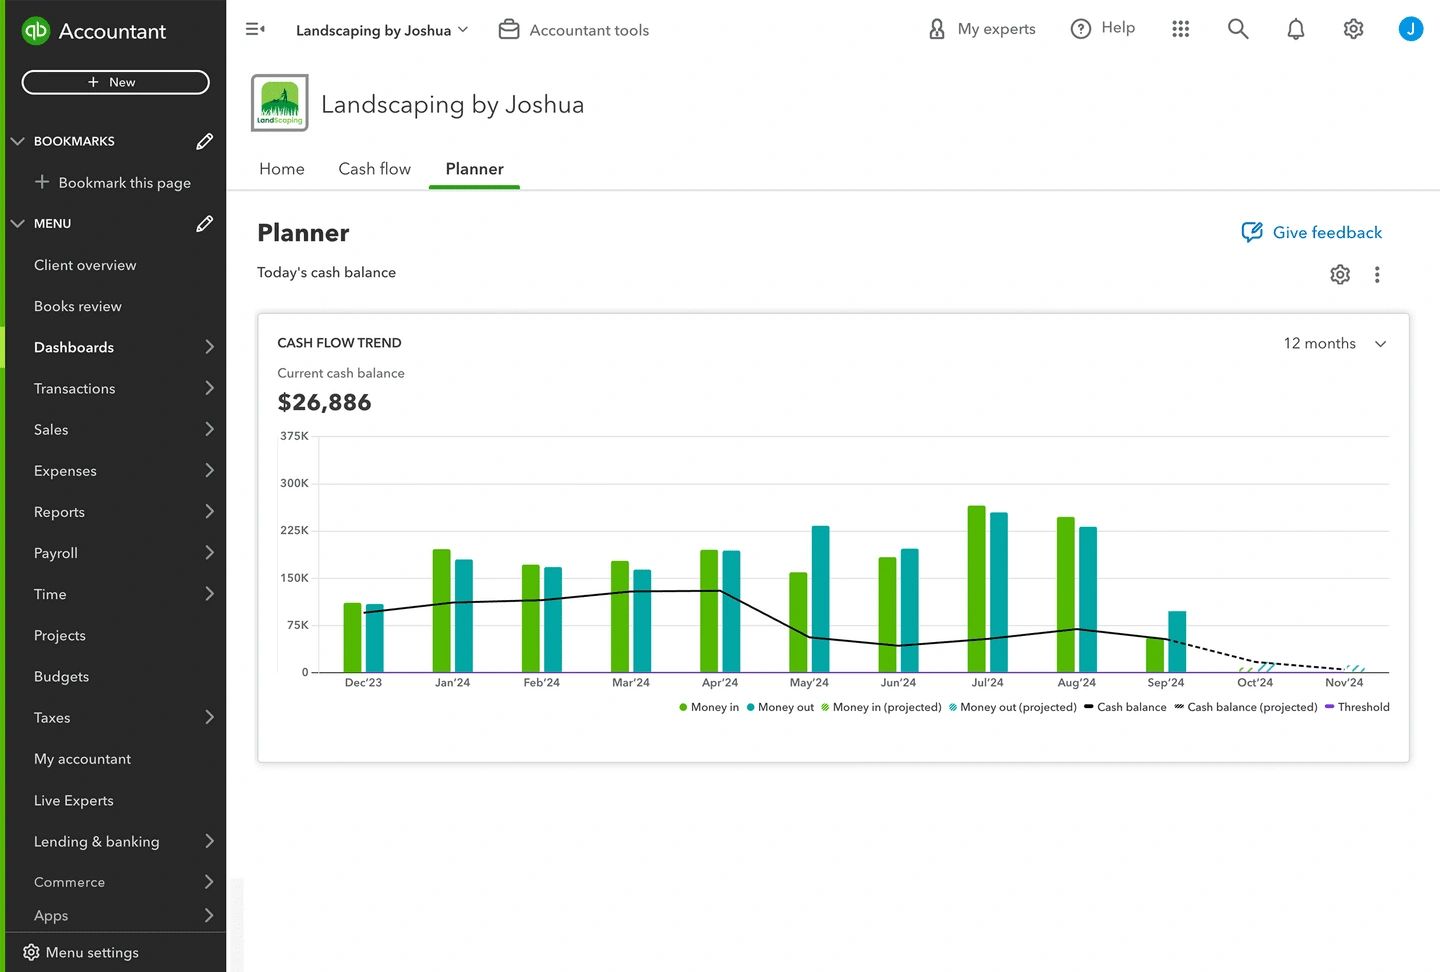
The Planner tab opens the Cash flow planner tool. The past data is based on actuals coming from the bank feed and the future is based on the upcoming invoices and bills already in QuickBooks. It also allows you to explore different scenarios by adding in items to see how they would affect future cash flow.
Any items added, or adjustments made in the planner, won’t affect your account in QuickBooks, your chart of accounts, or your online banking transactions. It’s a safe space to see how changes could affect cash flow.
Note: The cash flow planner is not available if you have multicurrency enabled.
The importance of connection
Both cash-planning tools use the data from connected bank and credit card accounts. If you use bank and credit card accounts that aren’t connected to QuickBooks, then you won’t see any data for past cash flow.
Check out our Free Additional Articles